This is the third post in my Kubernetes Controllers series. In the first post, we explored what controllers are and how they maintain your desired state through continuous reconciliation. In the second post I walk through how to build stable controllers from scratch. Now we’ll examine how three critical controllers interact to manage your applications.
We were rolling out a new version of an application. 100 pods, all running about 25% hot on CPU.
The HPA didn’t scale up. The rollout was throttled. Metrics were delayed. Traffic took a hit.
The frustrating part? Everything was working exactly as designed. The HPA wasn’t scaling because it was configured not to.
Kubernetes is a system of nested control loops. HPAs scale Deployments. Deployments manage ReplicaSets. ReplicaSets spin up Pods. Each loop has its own knobs. But what matters is how those loops interact, especially in moments like this.
Tuning your cluster isn’t about memorizing flags. It’s about understanding where the edges are and what happens when you push into them.
Core control loops
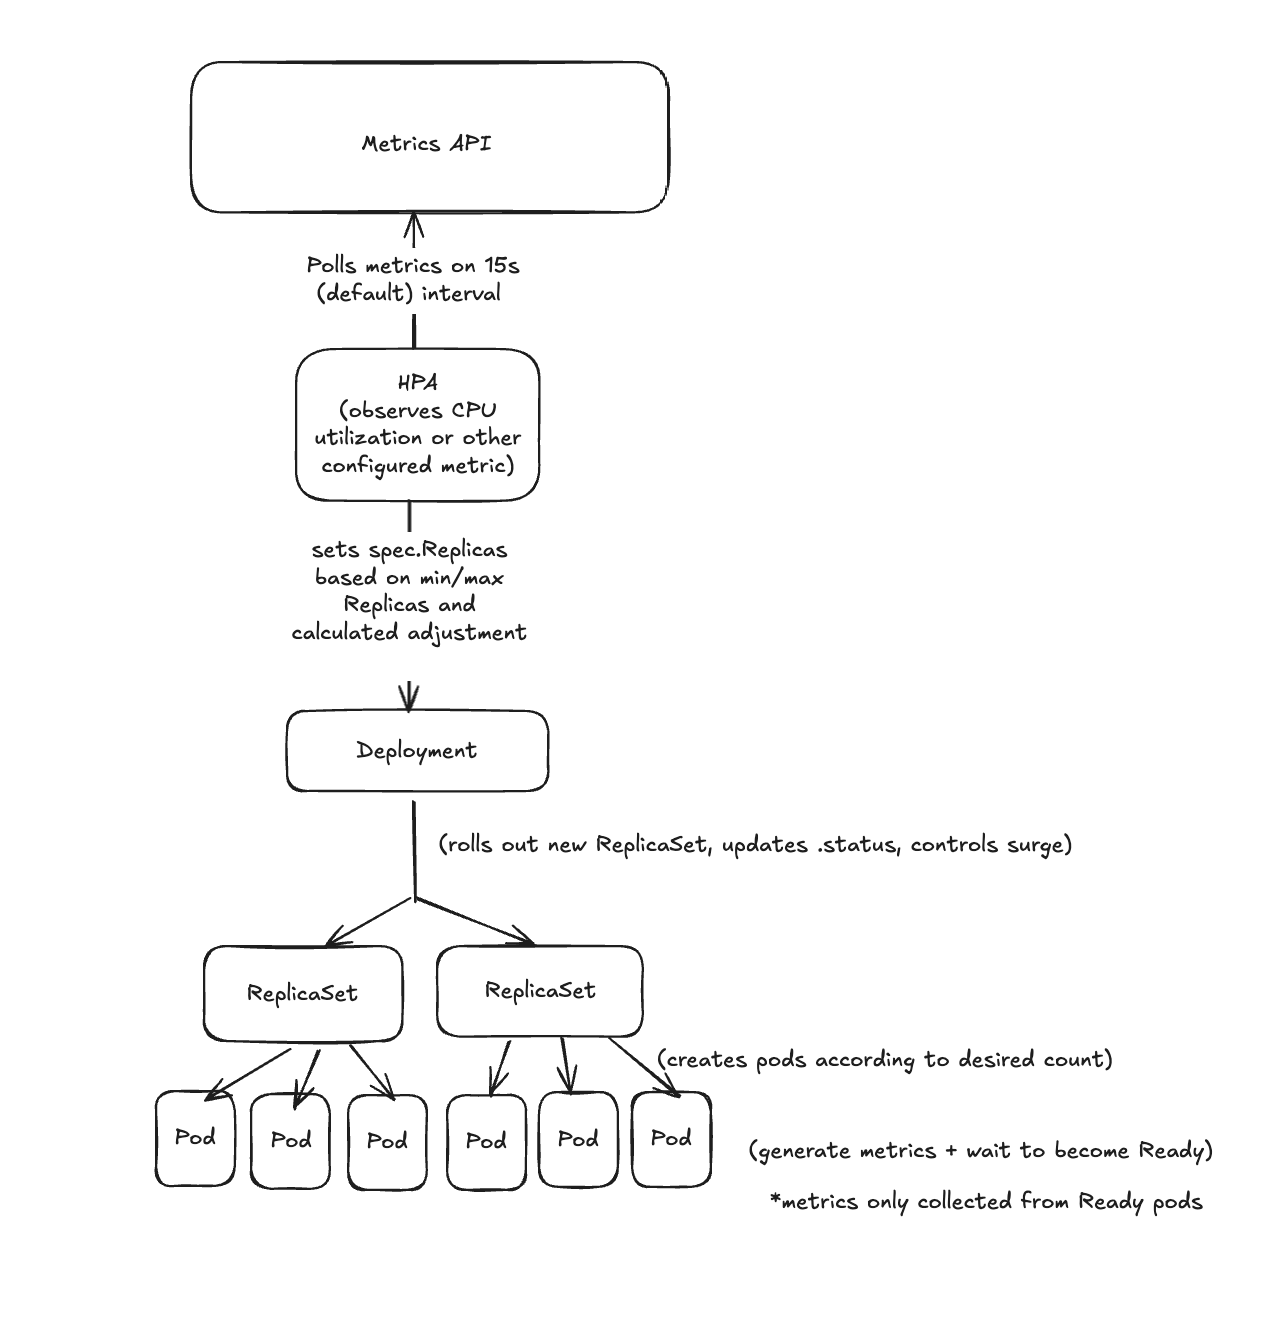
As I mentioned in the first post of the series, Kubernetes is built on reconciliation. Deployments, ReplicaSets, and HPAs are each their own control loop:
The HPA loop observes metrics and adjusts the replica count on a Deployment
The Deployment loop reconciles the desired replica count by adjusting ReplicaSets
The ReplicaSet loop reconciles its pod count by creating or deleting Pods
Each loop observes state, compares it with the desired target, and takes corrective action. If you want to understand what’s actually happening with your application deployments, it’s important to learn how to spot what actions are being taken and understand why.
Inspecting status fields
These control loops report their current state in .status fields. These are the first things you should check when something doesn’t look right.
Deployment status
kubectl get deployment demo -o yaml | yq .status
observedGeneration: The latest generation the controller has processedreplicas,updatedReplicas,availableReplicas: rollout progressconditions[]:Progressing: whether a rollout is ongoingAvailable: whether minimum availability has been met
If a rollout seems stuck, check if Progressing=True with a reason like ReplicaSetUpdated. If so, you’re likely waiting on pods to become Ready. Once the pods fully come up and report Ready, the Deployment will transition its Available condition to Status=True, Reason=# MinimumReplicasAvailable
ReplicaSet status
kubectl get rs -o yaml | yq '.items[] | {name: .metadata.name, status: .status}'
Look at replicas, readyReplicas, and availableReplicas. Those show how far along each ReplicaSet is. If you see a conditions[].type=ReplicaFailure, it might be a scheduling or crash loop issue. Debug with kubectl describe pod <foo> and check out the Events field.
HPA status
kubectl describe hpa
Check the current vs. target CPU utilization. Look at desiredReplicas vs. currentReplicas. And scan the Conditions[] field for clues like ScalingLimited, AbleToScale, or ScalingActive.
If you want to dig into metrics:
kubectl get --raw "/apis/custom.metrics.k8s.io/v1beta1" | jq
How ReplicaSets relate to Deployments
Deployments don’t create Pods directly. They create ReplicaSets. If the pod template changes (image, labels, env), a new ReplicaSet is created. The Deployment scales the new one up and the old one down. For example, take this sample deployment that manages an nginx app:
kubectl apply -f - <<EOF
apiVersion: apps/v1
kind: Deployment
metadata:
  name: demo-deployment
spec:
  replicas: 3
  selector:
    matchLabels:
      app: demo
  template:
    metadata:
      labels:
        app: demo
    spec:
      containers:
      - name: demo
        image: nginx:1.14.2
        ports:
        - containerPort: 80
EOF
Trigger a rollout to see the rollingUpdate in action:
kubectl set image deployment/demo-deployment demo=nginx:1.16.1
Watch it:
kubectl get rs
kubectl get events --sort-by=.metadata.creationTimestamp
You’ll see that the Deployment creates a new ReplicaSet and starts scaling up the new ReplicaSet while scaling down the old.
Why not manage ReplicaSets directly?
You could. But you’d be reimplementing rollbacks, surge logic, status tracking, and GC. Deployments handle that for you. For most workloads, Deployments give you the functionality you need to safely upgrade, automatically recycle unhealthy pods, and allow you to scale with changes in load when you attach an HPA to them.
That said, some tools (like Argo Rollouts) bypass Deployments and manage ReplicaSets directly. That gives them fine-grained control over metrics, gates, and promotion strategies. If you need canary, blue/green, or experiment-based rollout logic, this is usually why.
Tuning rollout behavior
If your application is experiencing some issues during deploys, take a look at tuning your rollout config.
By default, a Deployment will roll pods out a few at a time in attempt to maintain availability. But depending on your app, infra, and traffic patterns, the defaults could either not be aggressive enough or might be too aggressive.
Here’s what that looks like in config (you can see this on your Deployment object):
strategy:
  type: RollingUpdate
  rollingUpdate:
    maxSurge: 1
    maxUnavailable: 0
You can tune these to shape how rollouts behave:
| Goal | maxSurge | maxUnavailable | Behavior |
|---|---|---|---|
| Faster rollouts | High | High | More pods created/terminated in parallel |
| High stability | Low | 0 | Minimize disruption, one pod at a time |
| Resource constrained | 0 | 1 | No surge pods, slower rollout |
If you’ve got lots of traffic and startup takes a while, more maxSurge gives you headroom. If you’re tight on memory or have flaky readiness probes, you might want to slow things down.
There’s no perfect setting, just tradeoffs you can make based on profiling of your app. But it’s worth knowing that this knob exists before your next incident forces you to care.
Back to the opening issue: HPA doesn’t scale? Try reproducing it
So in order to fully understand the issue with the HPA not scaling the Deployment correctly during a rolling update, we recreated the failure in a kind cluster that was configured similarly to our environment. Here’s the setup:
1. kind config with autoscaler delays
# kind-config.yaml
kind: Cluster
apiVersion: kind.x-k8s.io/v1alpha4
name: hpa-test
nodes:
- role: control-plane
  kubeadmConfigPatches:
  - |
    kind: ClusterConfiguration
    controllerManager:
      extraArgs:
        horizontal-pod-autoscaler-initial-readiness-delay: "300s"
        horizontal-pod-autoscaler-sync-period: "60s"
- role: worker
kind create cluster --config kind-config.yaml
Those extraArgs on the controller manager control how the HPA behaves:
horizontal-pod-autoscaler-initial-readiness-delay=300smeans ignore metrics from a pod for 5 minutes after it becomes Ready. This avoids scaling too early based on noisy metrics from pods that are still warming up.horizontal-pod-autoscaler-sync-period=60stells the controller to evaluate metrics and scale every 60 seconds, instead of the default 15s. This makes the HPA slower to react but reduces unnecessary API churn and gives a bit more stability for workloads that spike briefly and recover.
You might choose more aggressive settings in environments where latency matters more than stability. For us it was about confidence: letting the app settle before autoscaling decisions kick in. And making sure we’re scaling based on steady signals, not flapping probes.
2. Deployment that burns CPU
To simulate real-world load, we use a toy Deployment that intentionally consumes CPU. It runs a busybox container in a tight loop to drive usage to 100m consistently. This helps demonstrate what happens when the app is hitting resource limits and the HPA is supposed to react.
The resources section ensures each pod is requesting exactly 100m, which aligns with our HPA target later. This makes the math easier to follow.
The readiness probe here just always returns success. You might use a proper probe in real apps, but for demos we want to minimize flake.
apiVersion: apps/v1
kind: Deployment
metadata:
  name: cpu-hog
spec:
  replicas: 3
  strategy:
    type: RollingUpdate
    rollingUpdate:
      maxSurge: 1
      maxUnavailable: 0
  selector:
    matchLabels:
      app: cpu-hog
  template:
    metadata:
      labels:
        app: cpu-hog
    spec:
      containers:
      - name: hog
        image: busybox
        command: ["sh", "-c", "while true; do :; done"]
        resources:
          limits:
            cpu: "100m"
          requests:
            cpu: "100m"
        readinessProbe:
          exec:
            command: ["true"]
          initialDelaySeconds: 1
          periodSeconds: 3
          timeoutSeconds: 1
kubectl apply -f cpu-hog-deployment.yaml
3. Attach an HPA
Next, we add a HorizontalPodAutoscaler that tracks CPU utilization. It watches the cpu-hog Deployment and tries to keep average usage around 50% of the requested CPU.
With our setup (each pod burns 100m and requests 100m), any pod running at full throttle will show up as 100% utilization. The HPA should see this and try to scale out to reduce average load.
We’re keeping minReplicas: 3 and maxReplicas: 10. These bounds help demonstrate scale-up and the effect of limits like maxSurge during rollouts.
This setup mirrors how many production services behave under bursty load, especially when request traffic ramps up faster than new pods can spin up and start reporting metrics.
apiVersion: autoscaling/v2
kind: HorizontalPodAutoscaler
metadata:
  name: cpu-hog-hpa
spec:
  scaleTargetRef:
    apiVersion: apps/v1
    kind: Deployment
    name: cpu-hog
  minReplicas: 3
  maxReplicas: 10
  metrics:
    - type: Resource
      resource:
        name: cpu
        target:
          type: Utilization
          averageUtilization: 50
kubectl apply -f hpa.yaml
4. Roll it out and watch
kubectl set image deployment/cpu-hog hog=busybox:1.36
kubectl get deploy cpu-hog -w
kubectl get rs -l app=cpu-hog -w
kubectl get pods -l app=cpu-hog -w
kubectl describe hpa cpu-hog-hpa
You’ll see the new replicaset come up and start to scale:
NAME                DESIRED   CURRENT   READY   AGE
cpu-hog-fb7fcf755   3         3         0       27s
cpu-hog-d57478c96   1         0         0       0s
cpu-hog-d57478c96   1         1         0       0s
Looking at the pod statuses:
kubectl get pods -l app=cpu-hog -w
NAME                       READY   STATUS        RESTARTS   AGE
cpu-hog-669b9bcb46-8n4n8   1/1     Running       0          26s
cpu-hog-669b9bcb46-dsbfk   1/1     Running       0          24s
cpu-hog-669b9bcb46-nsn6l   1/1     Running       0          28s
cpu-hog-669b9bcb46-tvh4c   1/1     Running       0          34s
cpu-hog-669b9bcb46-vrk9r   1/1     Running       0          32s
cpu-hog-669b9bcb46-zd5dq   1/1     Running       0          30s
Confirm the CPU burn:
kubectl top pods
NAME                       CPU(cores)   MEMORY(bytes)
cpu-hog-669b9bcb46-8n4n8   101m         0Mi
cpu-hog-669b9bcb46-dsbfk   100m         0Mi
cpu-hog-669b9bcb46-nsn6l   101m         0Mi
...
Now check how the HPA is responding:
kubectl describe hpa cpu-hog-hpa
Metrics:                                               ( current / target )
  resource cpu on pods  (as a percentage of request):  100% (100m) / 50%
Min replicas:                                          3
Max replicas:                                          10
Deployment pods:                                       6 current / 10 desired
Conditions:
  Type            Status  Reason            Message
  ----            ------  ------            -------
  AbleToScale     True    SucceededRescale  the HPA controller was able to update the target scale to 10
  ScalingActive   True    ValidMetricFound  the HPA was able to successfully calculate a replica count from cpu resource utilization (percentage of request)
  ScalingLimited  True    TooManyReplicas   the desired replica count is more than the maximum replica count
This is where the whole chain comes together. The HPA reads CPU metrics, calculates a new desired replica count, updates the Deployment, which updates the ReplicaSet, which spins up new Pods.
If any piece fails: readiness probe misfires, metrics aren’t available, rollout strategy throttles new pod availability, the system “works as designed” but still fails you operationally.
How the HPA Actually Calculates Desired Replicas
Here’s the formula used by the HorizontalPodAutoscaler controller:
desiredReplicas = ceil(currentReplicas × currentMetricValue / desiredMetricValue)
If the current CPU usage is 200m and your target is 100m, the HPA will try to double your replicas:ceil(3 × 200 / 100) = 6
If usage drops to 50m, you’ll likely scale down:ceil(3 × 50 / 100) = 2
It skips scaling altogether if the result is close to 1.0 — by default, within 10%.
Pods that are shutting down or not Ready are ignored during calculation. So are failed pods and anything that’s missing metrics.
That means if your app takes a while to become Ready — or if your metrics backend isn’t scraping yet — the HPA might scale based on a partial view of the world.
Subtle failures that block scaling
You’ve seen the happy path and an example of the unhappy path, now here are some things to look out for that might bite you.
Readiness probes that delay metrics
The HPA doesn’t count pods that aren’t Ready. If your readiness probe takes 60s, the autoscaler has to wait. Combine that with a rollout limited to one surge pod at a time, and you end up blind.
The fix is obvious, but easy to overlook. Don’t make your probe wait unless it has to. And if your cluster supports it, tune --horizontal-pod-autoscaler-initial-readiness-delay down from the default.
CPU requests that don’t reflect reality
The HPA calculates usage as a percentage of requests.cpu. Not actual usage. If your app regularly uses 100m but requests 300m, the HPA sees 33%. It won’t scale.
Or worse, if your request is too low, it scales too aggressively. Either way, the signal is distorted.
Set requests based on observed steady-state load. Not the worst spike you’ve ever seen. Not whatever value someone copy-pasted from a service they barely remember.
PDBs that quietly block evictions
Sometimes the rollout hangs. You’re stuck waiting on a pod to terminate, but it won’t. You check events and see:
Cannot evict pod as it would violate the pod's disruption budget
That’s your PodDisruptionBudget doing its job. It’s just doing it too well. If minAvailable is too high, the rollout can’t proceed. And the HPA can’t scale down either.
This is easy to miss. The control plane won’t scream about it. But the rollout will stall until the PDB allows it.
Liveness probes that kill good pods
Under load, a pod slows down. The liveness probe fails. Kubernetes restarts it. Now the pod is unready. Metrics stop flowing. The HPA ignores it.
You get a feedback loop: load increases, restarts increase, available capacity drops, and scaling doesn’t happen.
If your app doesn’t hang, don’t use a liveness probe. Or at least configure it to tolerate spikes. Use startupProbe if you need one-time boot protection.
Final thoughts
HPAs adjust replica counts. Deployments coordinate rollouts. ReplicaSets spin up pods. Each controller sticks to its job, and it’s our job to understand how these things interact.
None of the controllers see the full picture. So when traffic spikes during a rollout, or metrics lag behind new pods, you end up with a system that feels stuck. Not because it’s broken, but because the coordination wasn’t built in.
Tuning this is a mix of modifying configuration options, watching where these control loops step on each other, and designing around the blind spots - especially as it relates to your application.
The more you understand how these controllers interact, the better you’ll get at shaping their behavior before an outage teaches you the hard way.